Management Procedures
Evidence from fisheries that are managed via harvest strategies that have been tested in simulations supports a view that testing offers clear advantages over no testing. Harvest strategies or management procedures are algorithms that partially replace a formally social decision-making process — for example, a management procedure might specify which data is to be collected, how it should be analysed, and what decisions should automatically follow in order to achieve management objectives.
The difficult part is to identify management objectives and translate them to an extent that is possible into statistics that could be monitored in the simulations to see how various management procedures perform. Not all management objectives are intuitive to translate: fairness or equitability of access, maintaining ecological function, safeguarding employment, preservation of cultural or relational values are challenging but not always impossible (see Objectives figure below).
Some objectives related to “safety” need to be expressed in terms of risk: the stock should avoid low levels with high probability. MPs that do not meet pre-agreed safety criteria for the reference set of OMs should be rejected.
One of the key advantages of MSEs is their ability to quantify tradeoffs among different objectives.
![[ Figure: Management Objectives ]](iotc/images/figures/Objectives.svg)
![[ Figure: Management Objectives ]](iotc/images/figures/Objectives-S.png)
There is an ecosystem of values that feed into formulating management objectives.
The relationship between these values and the statistics used to represent them in the MSE model is often unclear.
Management procedures should be relatively realistic, that is, the simulated data that is available to the management procedure should have an equivalent in the real world, for example, a particular CPUE index or a fisheries independent survey.
Simulations can help identify biases in our perception of management’s success and tell us how these biases depend on the quality / quantity of data and / or on the simplifying assumptions we make in the estimating model.
Two Harvest Control Rules: CPUE and Hockey Stick based
The management procedure operates in two steps: first, it learns something about the simulated stock (e.g. from simulated observations and an estimation algorithm). In the second step, it decides what management actions should be adopted via an algorithm called Harvest Control Rule (HCR) (see the two types of HCR figures below). For example, if an MP estimates that the stock (in a particular year, in a particular virtual world) is below MSY, its response could be to reduce fishing pressure.
This is the basic algorithm for Hockey Stick-based management procedures (MP4, MP5, and MP6) which first estimate a depletion level (X-axis value) from simulated data, then decide on the catch (Y-axis value) using the Hockey Stick graph. For CPUE-based management procedures (MP1, MP2, and MP3) the decision is based on the estimated level of stock depletion but directly on (simulated) CPUE trend, if CPUE falls below target, catch is reduced.


Two types of HCRs in our swordfish MSE illustration. Both set TAC for 3 years, changing it by no more than 15% at a time.
Three levels of tuning: 50%, 60%, or 70% chance of being in the Kobe green zone
Harvest Control Rules are devised with a degree of flexibility, and can be made more or less reactive via tuning parameters: adjusting aspects, such as the sensitivity of a management response to stock decline. An HCR algorithm can be tuned until the algorithm is seen to ‘work’ in simulations — for example, it manages to maintain the stock within the Kobe green zone with 70% probability, within an agreed timeframe.
The values of the tuning parameters can have a greater impact on the performance of the management procedure than the general principle behind the algorithm. That is, the differences between MP3 and MP6 that are both tuned to maintain the stock in the Kobe green zone with 70% are smaller than between MP1 and MP3 that are both relying on the same (CPUE) HCR but are tuned to different levels of expected perfomance.
Exploring overall performance of management procedures
The quilt table is a popular form to summarise results and examine trade-offs.
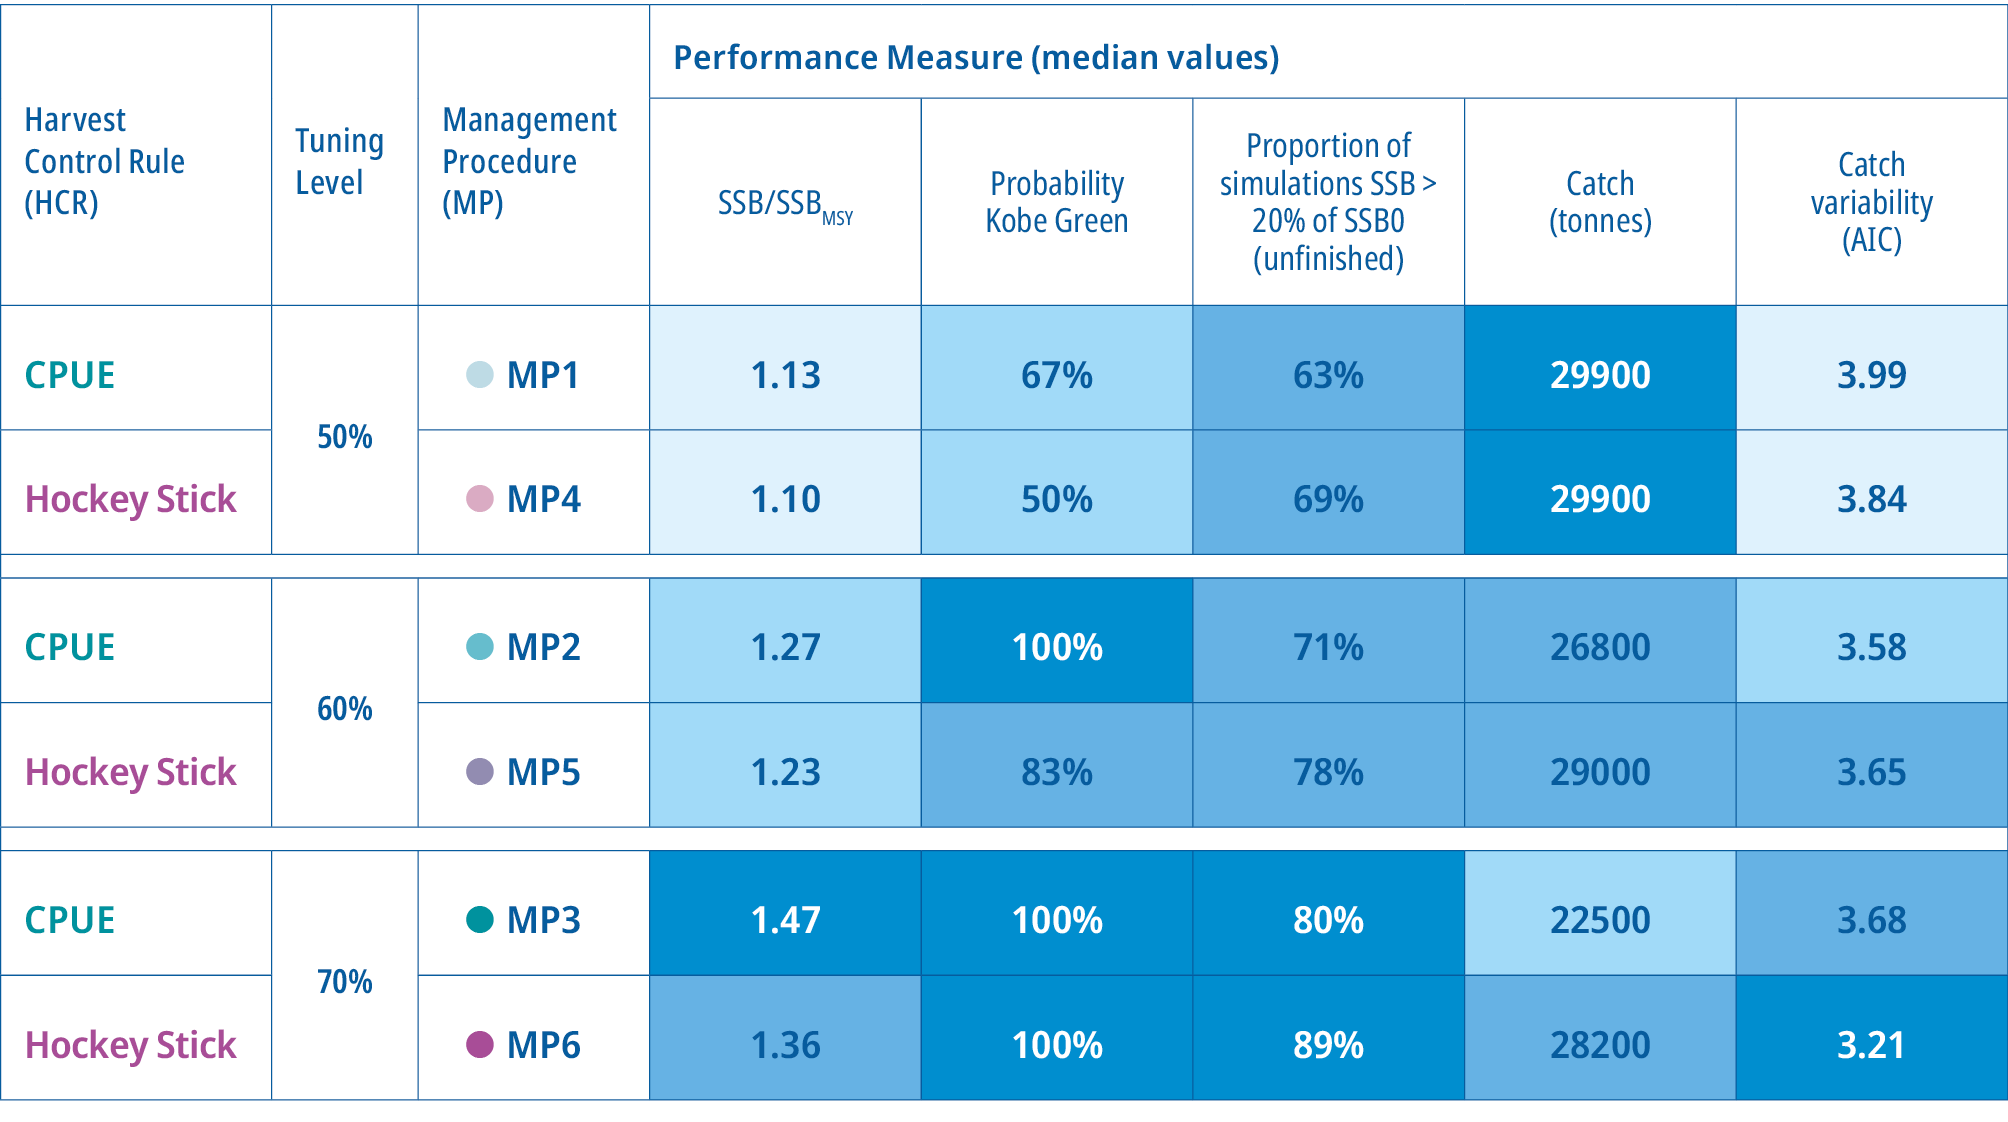
Performance of six MPs measured by five statistics. The MPs are sorted by tuning level. Darker shading represents better performance, however, the boundaries which determine shading are arbitrary. Moreover, quilt colour coding creates a false sense of comparability between categories that are valued differently by different stakeholders.
The IOTC adopted other standardised formats for visualising performance of MPs.

Kobe quadrants. Kobe green, or the safety region, is where SSB is above SSBMSY and F is below FMSY.

Box plots compare performance in relation to FMSY and SSBMSY.

Pairwise trade-offs, between Catch / Catch Variability (left) and Catch / Safety (right).